单细胞 芯片 转录组测序的数据挖掘文章一比一复现
自己造轮子

(生信技能树优秀学员“细心的网友”)


马拉松授课线上直播课程,最近的一期是5月8号(今晚七点半)开课哦:
生信入门&数据挖掘线上直播课5月班
文章复现:Integration of Single-Cell RNA Sequencing and Bulk RNA Sequencing Data to Establish and Validate a Prognostic Model for Patients With Lung Adenocarcinoma
全文数据分析,没有湿实验。在GEO数据库下载了一份scRNA的数据,两份基因芯片的数据,还下载了TCGA的数据。研究肺腺癌(LUAD),整合scRNA-seq和传统的RNA-seq数据来构建LUAD患者的预后模型,并采用两个外部验证队列来验证其风险分层能力。
文章整体思路如下:
单细胞降维分群注释,找出tumor和normal间关键细胞类型。单细胞功能富集,拟时序分析,细胞通讯分析TCGA数据进行差异分析,GO,KEGG功能富集TCGA数据进行WGCNA分析,找到hub gene后,取hub gene和TCGA DEGs的交集,进行后续分析单因素Cox回归鉴定潜在的预后DEGs,非负矩阵分解进行sample clustering(亚型),不同cluster的生存分析,免疫浸润分析单因素Cox回归筛选出的gene用LASSO模型进一步筛选,筛选完后进行多因素Cox回归,计算每个样本的risk score,根据risk score分成两类,进行生存分析,将构建的模型应用于两个GEO芯片数据,进行同样分析高危低危人群与临床信息相关性分析,分析risk score是否可作为预后指标,基因突变分析ssGSEA分析,免疫检查点与肿瘤突变负荷分析
本次复现只是为了复现图表,数据不一定具有生物学意义(大家可以理解为凑图或者灌水)
Step 1.单细胞数据处理
先下载好数据,一共4个样本就新建4个文件夹,名字命名成样本名,文件夹内带'GSM'开头的数据是下载的原始数据,重新复制一份,把文件名改成标准的read10x函数读入格式,一定注意名字不要写错。

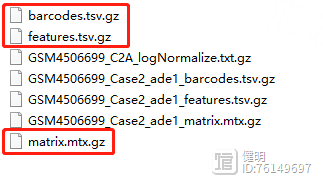
一定要保证这3个文件同时存在,而且在同一个文件夹下面。
示例代码是:
rm(list=ls())options(stringsAsFactors = F)library(Seurat)sce1 <- CreateSeuratObject(Read10X('../10x-results/WT/'), "wt")
重点就是 Read10X 函数读取 文件夹路径,比如:../10x-results/WT/ ,保证文件夹下面有3个文件。
1.1 QC
library(Seurat)library(harmony)
library(dplyr)
library(stringr)
rm(list = ls())
# 多个数据读取与合并
rawdata_path <- './rawdata'
filename <- list.files(rawdata_path)
rawdata_path <- paste(rawdata_path,filename,sep = '/')
sceList <- lapply(rawdata_path, function(x){
obj <- CreateSeuratObject(counts = Read10X(x),
project = str_split(x,'/')[[1]][3])
})
names(sceList) <- filename
这里sceList是一个列表,列表里共4个元素,每个元素都是一个seurat对象,每个元素的名字就是上面的样本名。rawdata_path就是上面下载的.gz文件 所在文件夹的路径,Read10X函数只需要传入文件夹路径就可以自动读入数。

project参数传入的是一个字符串,一般用样本名即可,这里用str_split函数分割路径字符串得到样本名

sce <- merge(sceList[[1]],sceList[-1],add.cell.ids = names(sceList),project = 'luad')
sce@meta.data$group <- str_split(sce@meta.data$orig.ident,'_',simplify = T)[,2]
把4个seurat对象用merge函数合并后,看一下每个细胞的基本信息,这里我根据作者给出的信息,把疾病和正常分成两组,又增加了一列,ade1是疾病,nor是正常


# 查看线粒体(MT开头)、核糖体(RPS/RPL开头)、血红细胞所占比例
grep('^MT',x=rownames(sce@assays$RNA@data),value = T)
grep('^RP[SL]',x=rownames(sce@assays$RNA@data),value = T)
grep('^HB[^(P)]',x=rownames(sce@assays$RNA@data),value = T)
sce <- PercentageFeatureSet(sce,'^MT',col.name = 'percent_MT')
sce <- PercentageFeatureSet(sce,'^RP[SL]',col.name = 'percent_RP')
sce <- PercentageFeatureSet(sce,'^HB[^(P)]',col.name = 'percent_HB')
VlnPlot(sce,features = "nCount_RNA",pt.size = 0,y.max = 10000)
VlnPlot(sce,features = "nFeature_RNA",pt.size = 0,y.max = 2500)
VlnPlot(sce,features = "percent_MT",pt.size = 0)
VlnPlot(sce,features = "percent_RP",pt.size = 0)
VlnPlot(sce,features = "percent_HB",pt.size = 0,y.max = 0.1)
VlnPlot(sce,features = c("nCount_RNA","nFeature_RNA","percent_MT"),pt.size = 0,group.by = 'orig.ident')
对于每个细胞,我又添加了三列信息:线粒体基因占比,核糖体基因占比,红细胞基因占比。这几列用来过滤数据,这里重新给sce赋值是因为,PercentageFeatureSet函数的返回值还是一个seurat对象,和原来的sce相比, 就只是在meta data里多了一列而已,所以直接重新赋值,把原来的seurat对象sce给更新掉


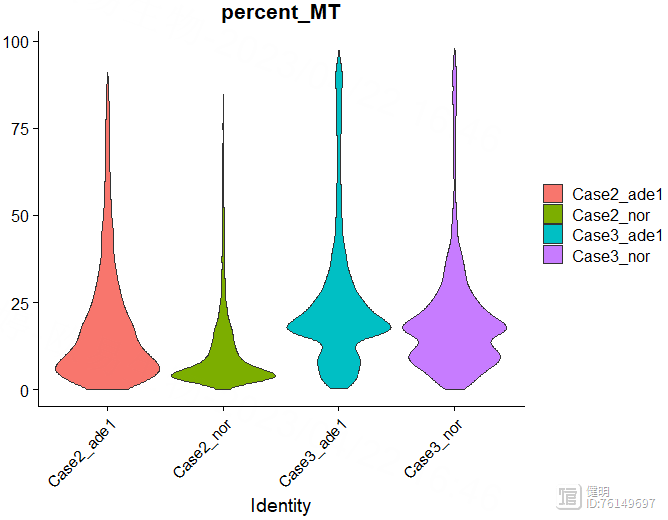
过滤前先看下数据,32538个gene,13060个细胞

# 过滤细胞
sce <- subset(sce,subset = nCount_RNA>1000 & nFeature_RNA>300 & percent_MT<25)
# 过滤基因
sce <- sce[rowSums(sce@assays$RNA@counts>0)>3,]
# 过滤线粒体、核糖体、血红细胞进占比高的细胞
sce <- subset(sce,subset = percent_MT<25 & percent_RP<30 & percent_HB<0.1)
过滤完后22249个gene,7892个细胞

# 细胞周期评分
# S.Score较高的为S期,G2M.Score较高的为G2M期,都比较低的为G1期
s_feature <- cc.genes.updated.2019$s.genes
g2m_feature <- cc.genes.updated.2019$g2m.genes
sce <- CellCycleScoring(sce,
s.features = s_feature,
g2m.features = g2m_feature,
set.ident = T)
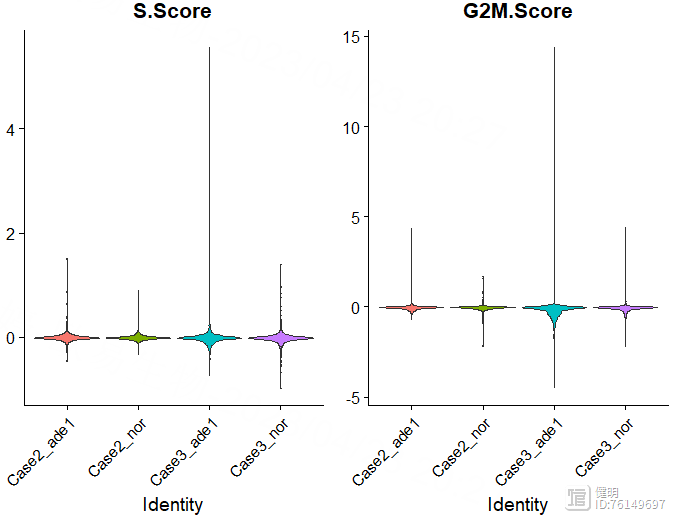
VlnPlot(sce,features = c('S.Score','G2M.Score'),group.by = 'orig.ident',pt.size = 0)
saveRDS(sce,'sce_qc.rds')
再看一下细胞周期,把细胞周期两个评分加到meta data里,更新sce
1.2 用harmony去除批次效应
library(harmony)library(dplyr)
library(Seurat)
library(clustree)
rm(list = ls())
sce <- readRDS('sce_qc.rds')
sce <- NormalizeData(sce,
normalization.method = 'LogNormalize',
scale.factor = 10000)
sce <- FindVariableFeatures(sce,
selection.method = "vst",
nfeatures = 2000)
# 默认用variableFeature做scale
sce <- ScaleData(sce)
sce <- RunPCA(sce,features = VariableFeatures(sce))
DimPlot(sce,reduction = 'pca',group.by = 'group')
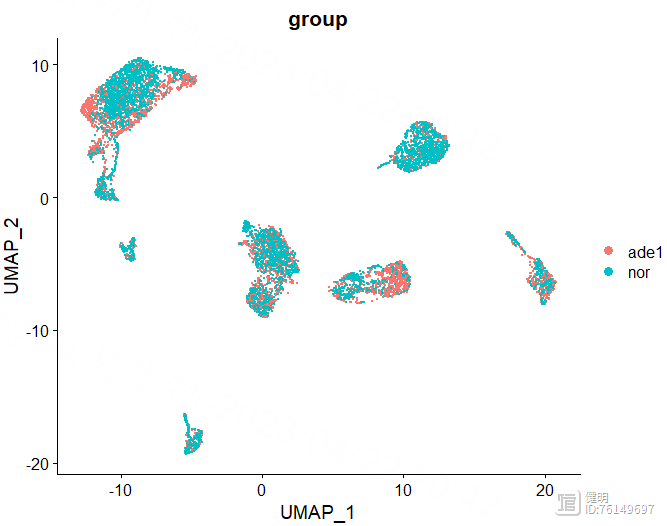
从PCA降维的结果看,两个组的批次效应不大,均匀的混合在一起,但是这里还是用harmony试试

sce <- RunHarmony(sce,group.by.vars = 'orig.ident')
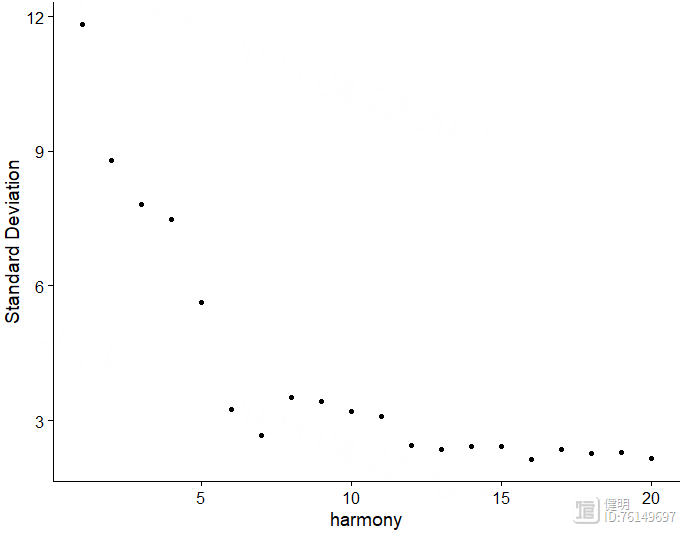
ElbowPlot(sce,reduction = 'harmony')
sce <- RunUMAP(sce,dims = 1:10,reduction = 'harmony')
sce <- RunTSNE(sce,dims = 1:10,reduction = 'harmony')
DimPlot(sce,reduction = 'umap',label = T,group.by = 'group')
DimPlot(sce,reduction = 'tsne',label = T,group.by = 'group')
选择orig.ident这一列,去除4个样本之间的批次效应。根据肘部图确定降维后的维度。
sce <- FindNeighbors(sce,reduction = 'harmony',dims = 1:10)
sce_res <- FindClusters(sce_res,resolution = 0.8)
# 设置不同的分辨率查看分组情况
sce_res <- sce
for (i in c(0.01, 0.05, 0.1, 0.2, 0.3, 0.5,0.8,1)){
sce_res <- FindClusters(sce_res,resolution = i)
}
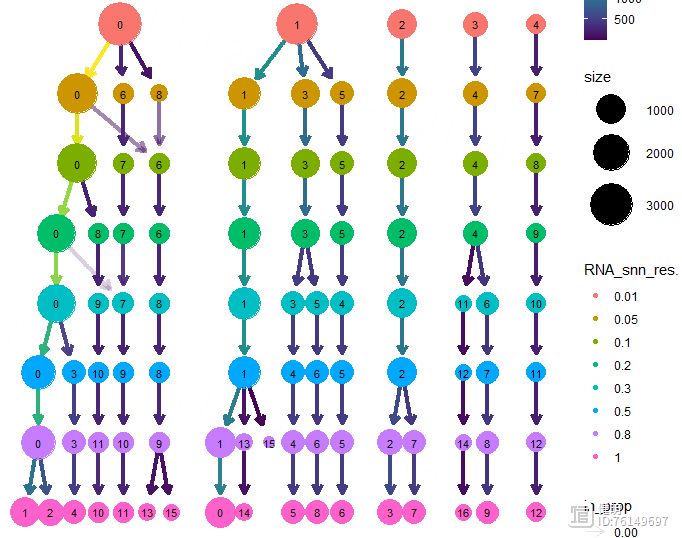
clustree(sce_res,prefix = 'RNA_snn_res.')
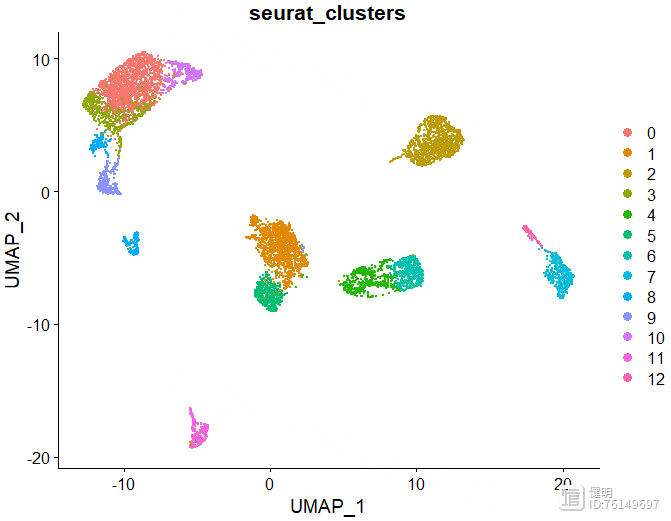
FindNeighbors函数计算细胞间的距离,FindClusters函数确定分群结果。上面的UMAP看着大概分了7坨,但实际上并不是7个分群,实际分群数量还是要看FindClusters的结果。FindClusters函数分辨率不同,分群数量会不同,具体分多少需要摸索。这里分辨率选了0.5,对应第六行蓝色,13个分群,如果选0.8的话,感觉分群数量会突然增加好多,不太合适。
sce <- FindClusters(sce,resolution = 0.5)
saveRDS(sce,file = 'step2_harmony.rds')
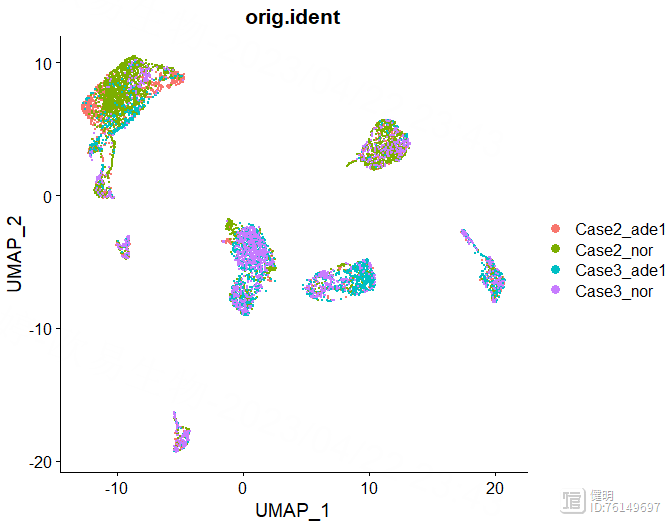
DimPlot(sce,reduction = 'umap',group.by = 'orig.ident')
DimPlot(sce,reduction = 'umap',group.by = 'seurat_clusters')
确定好分辨率后,分群赋值给sce,在meta data里会多出来两列,这两列是一样的,表示每个细胞分在哪个cluster里,最后保存一下更新后的sce对象,再来看下分群结果

1.3 细胞注释
library(SingleR)library(celldex)
library(Seurat)
library(dplyr)
library(stringr)
library(pheatmap)
library(ReactomeGSA)
library(monocle)
library(limma)
library(ggplot2)
library(msigdbr)
library(singleseqgset)
rm(list = ls())
gc()
sce <- readRDS('step2_harmony.rds')
# singleR注释
hpca.se <- HumanPrimaryCellAtlasData()
bpe.se <- BlueprintEncodeData()
anno <- SingleR(sce@assays$RNA@data,
ref = list(BP=bpe.se,HPCA=hpca.se),
labels = list(bpe.se$label.main,hpca.se$label.main),
clusters = sce@meta.data$seurat_clusters
)
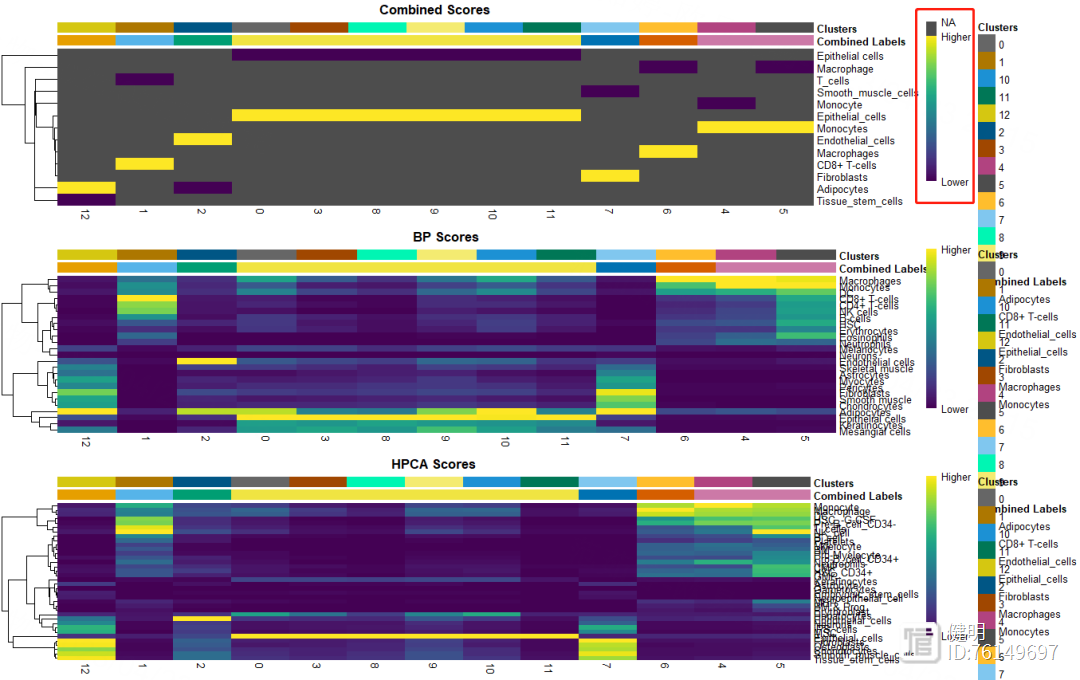
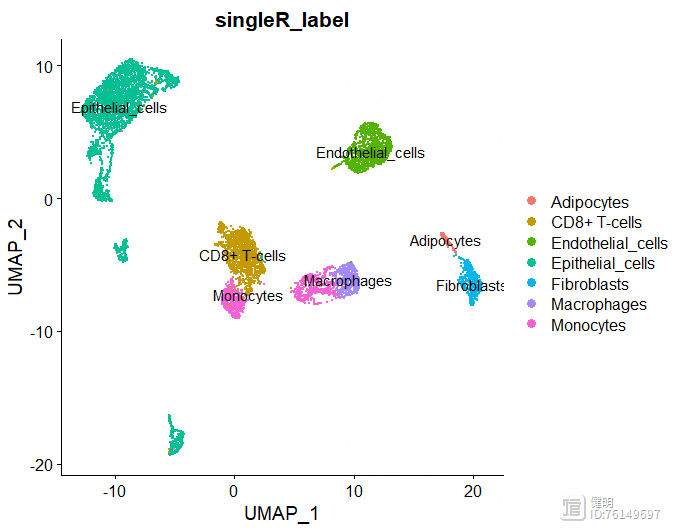
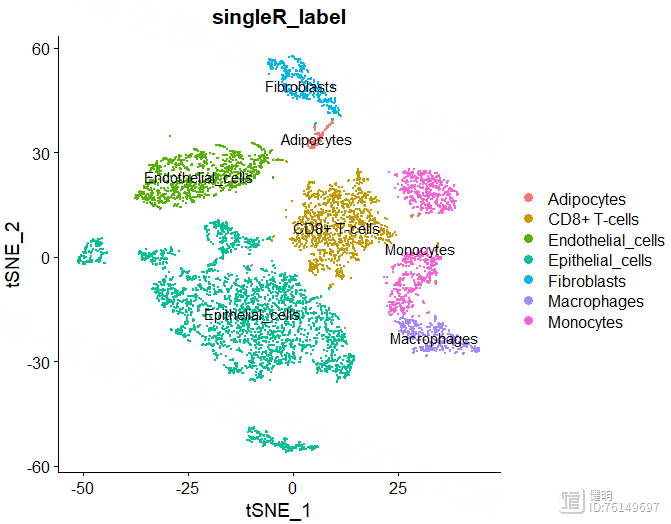
用SingleR自动注释,HumanPrimaryCellAtlasData和BlueprintEncodeData是SingleR自带的两个数据库,用两个数据库注释效果好像比一个会好点。得到的anno也是一个对象,每个细胞群的注释信息就藏在里面,13个分群被注释成7种细胞,其中有6个分群都是上皮细胞,也许上皮细胞还能继续细分。想继续细分的话,对sce取子集,把标签为上皮细胞的细胞取出来,降维分群,丢到SingleR()函数里再注释

plotScoreHeatmap(anno,clusters = anno@rownames,show_colnames = T)
再看下注释结果的打分,不满意的话也可以手动注释
sce@meta.data$singleR_label <- unlist(lapply(sce@meta.data$seurat_clusters, function(x){anno$labels[x]}))
DimPlot(sce,reduction = 'umap',group.by = 'singleR_label',label = T)
DimPlot(sce,reduction = 'tsne',group.by = 'singleR_label',label = T)


anno里面有每个分群对应的注释信息,把这个信息添加到sce的meta data里,然后就可以在分群的图上添加上注释信息了
1.4 鉴定关键细胞类型
cell_list <- split(colnames(sce), sce$singleR_label)deg <- c()
for (i in names(cell_list)){
sce_temp <- sce[,colnames(sce) %in% cell_list[[i]]]
sce_temp <- CreateSeuratObject(counts = sce_temp@assays$RNA@counts,
meta.data = sce_temp@meta.data,
min.cells = 3,
min.features = 200)
sce_temp <- NormalizeData(sce_temp)
sce_temp <- FindVariableFeatures(sce_temp)
sce_temp <- ScaleData(sce_temp,vars.to.regress = c('nFeature_RNA','"percent_MT"'))
Idents(sce_temp) <- sce_temp$group
sce_temp_markers <- FindAllMarkers(object=sce_temp,
only.pos = T,
logfc.threshold = 2,
min.pct = 0.1)
sce_temp_markers <- sce_temp_markers[order(sce_temp_markers$cluster,sce_temp_markers$avg_log2FC),]
deg_gene <- sce_temp_markers[sce_temp_markers$p_val_adj<0.05,'gene']
deg <- c(deg,length(deg_gene))
}
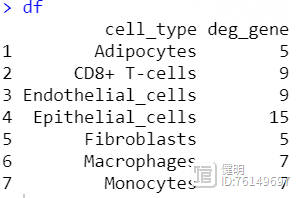
df <- data.frame(cell_type = names(cell_list),deg_gene = deg)
把每种类型的细胞分别拿出来,用FindAllMarkers找出ade1和nor组之间的差异基因
1.5 单细胞通路富集
temp <- sceIdents(temp) <- temp@meta.data$singleR_label
reactome_obj <- analyse_sc_clusters(temp,create_reactome_visualization=T,use_interactors=F)
path_ways <- pathways(reactome_obj)
path_ways$diff <- rowMax(as.matrix(path_ways[,2:ncol(path_ways)])) - rowMin(as.matrix(path_ways[,2:ncol(path_ways)]))
path_ways <- path_ways[order(path_ways$diff,decreasing = T),]
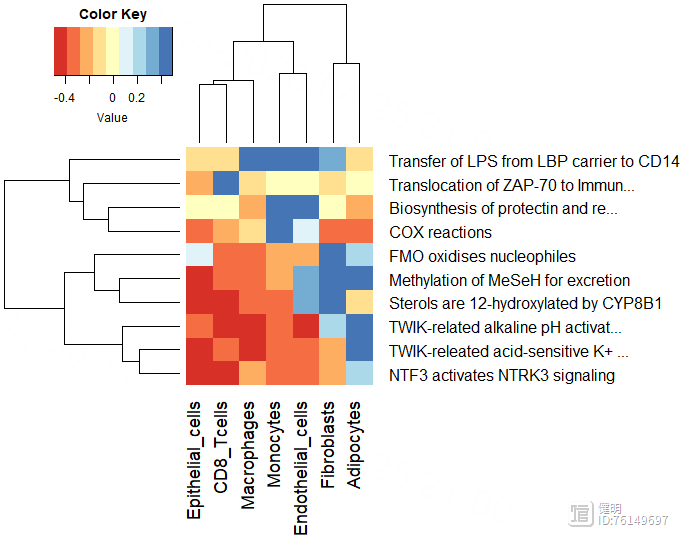
plot_gsva_heatmap(reactome_obj,rownames(path_ways)[1:10],margins = c(10,20))
saveRDS(sce,file = 'step3_sce.rds')
用pathway()提取富集出来的结果,每行是一个通路,每列是一种细胞,计算每个通路在7种细胞中表达差异的diff,根据diff排序,画出前10个通路

1.6 拟时序分析
library(Seurat)library(monocle)
sce <- readRDS('step3_sce.rds')
# 1. 将seurat对象转化为monocle的CDS对象
sparse_data <- as(as.matrix(sce@assays$RNA@counts),'sparseMatrix')
mdata <- new('AnnotatedDataFrame',data=sce@meta.data) # 行为cell
fData <- data.frame(gene_short_name=row.names(sparse_data),row.names = row.names(sparse_data))
fd <- new('AnnotatedDataFrame',data=fData) # 行为gene 列为gene description
monocle_cds <- newCellDataSet(cellData = sparse_data,
phenoData = mdata,
featureData = fd,
lowerDetectionLimit = 0.5,
expressionFamily = negbinomial.size())
# 2. 计算size factor和离散度
monocle_cds <- estimateSizeFactors(monocle_cds)
monocle_cds <- estimateDispersions(monocle_cds)
# 3.过滤低质量细胞
monocle_cds <- detectGenes(monocle_cds,min_expr = 0.1)
# 4. 找高变基因、降维分群
# 用seurat找的高变基因
sce_var_gene <- VariableFeatures(sce)
monocle_cds <- setOrderingFilter(monocle_cds,sce_var_gene)
monocle_cds <- reduceDimension(monocle_cds,num_dim=10,norm_method = 'log',reduction_method = 'tSNE')
monocle_cds <- clusterCells(monocle_cds,num_clusters = 10)
plot_cell_clusters(monocle_cds,color_by = 'singleR_label')
diff_test_gene <- differentialGeneTest(monocle_cds[sce_var_gene,],fullModelFormulaStr = '~singleR_label')
diff_gene <- row.names(subset(diff_test_gene,qval<0.01))
monocle_cds <- setOrderingFilter(monocle_cds,diff_gene)
# 5. 用reversed graph embedding降维
monocle_cds <- reduceDimension(monocle_cds,reduction_method = 'DDRTree')
# 6. 计算细胞拟时间
monocle_cds <- orderCells(monocle_cds)
这里运行到第六步,orderCells()函数大概率会报错,详细的解决办法可以参考知乎上的贴子https://zhuanlan.zhihu.com/p/589134519 ,这里说一下大概解决步骤
下载一个包,'igraph’下载一个R文件,order_cells.R,链接在知乎贴子里,然后source调用把orderCells()中用DDRTree计算的那部分代码单独拿出来,写成一个函数,后面直接调用,记得给出返回值。或者不封装成函数的形式也行,那就不需要返回值了# 6. 计算细胞拟时间
source('order_cells.R')
library('igraph')
my_ordercell <- function(cds){
root_state = NULL
num_paths = NULL
reverse = NULL
root_cell <- select_root_cell(cds, root_state, reverse)
cds@auxOrderingData <- new.env(hash = TRUE)
if (cds@dim_reduce_type == "DDRTree") {
if (is.null(num_paths) == FALSE) {
message("Warning: num_paths only valid for method 'ICA' in reduceDimension()")
}
cc_ordering <- extract_ddrtree_ordering(cds, root_cell)
pData(cds)$Pseudotime <- cc_ordering[row.names(pData(cds)), ]$pseudo_time
K_old <- reducedDimK(cds)
old_dp <- cellPairwiseDistances(cds)
old_mst <- minSpanningTree(cds)
old_A <- reducedDimA(cds)
old_W <- reducedDimW(cds)
cds <- project2MST(cds, project_point_to_line_segment)
minSpanningTree(cds) <- cds@auxOrderingData[[cds@dim_reduce_type]]$pr_graph_cell_proj_tree
root_cell_idx <- which(V(old_mst)$name == root_cell, arr.ind = T)
cells_mapped_to_graph_root <- which(cds@auxOrderingData[["DDRTree"]]$pr_graph_cell_proj_closest_vertex == root_cell_idx)
if (length(cells_mapped_to_graph_root) == 0) {
cells_mapped_to_graph_root <- root_cell_idx
}
cells_mapped_to_graph_root <- V(minSpanningTree(cds))[cells_mapped_to_graph_root]$name
tip_leaves <- names(which(degree(minSpanningTree(cds)) == 1))
root_cell <- cells_mapped_to_graph_root[cells_mapped_to_graph_root %in% tip_leaves][1]
if (is.na(root_cell)) {
root_cell <- select_root_cell(cds, root_state, reverse)
}
cds@auxOrderingData[[cds@dim_reduce_type]]$root_cell <- root_cell
cc_ordering_new_pseudotime <- extract_ddrtree_ordering(cds, root_cell)
pData(cds)$Pseudotime <- cc_ordering_new_pseudotime[row.names(pData(cds)), ]$pseudo_time
if (is.null(root_state) == TRUE) {
closest_vertex <- cds@auxOrderingData[["DDRTree"]]$pr_graph_cell_proj_closest_vertex
pData(cds)$State <- cc_ordering[closest_vertex[, 1], ]$cell_state
}
}
cds
}
monocle_cds <- my_ordercell(monocle_cds)
# 可以画图了
plot_cell_trajectory(monocle_cds,color_by = 'Pseudotime')
plot_cell_trajectory(monocle_cds,color_by = 'State')
plot_cell_trajectory(monocle_cds,color_by = 'singleR_label')
plot_cell_trajectory(monocle_cds,color_by = 'singleR_label') facet_wrap(~singleR_label,nrow = 3)
saveRDS(monocle_cds,file = 'monocle.rds')
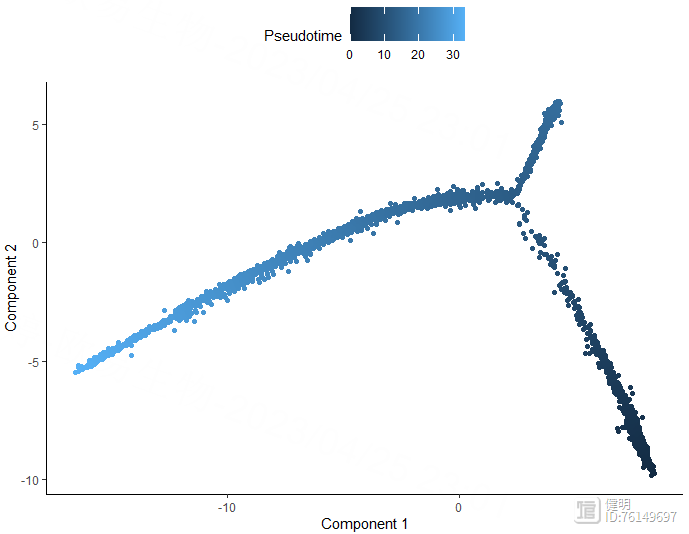
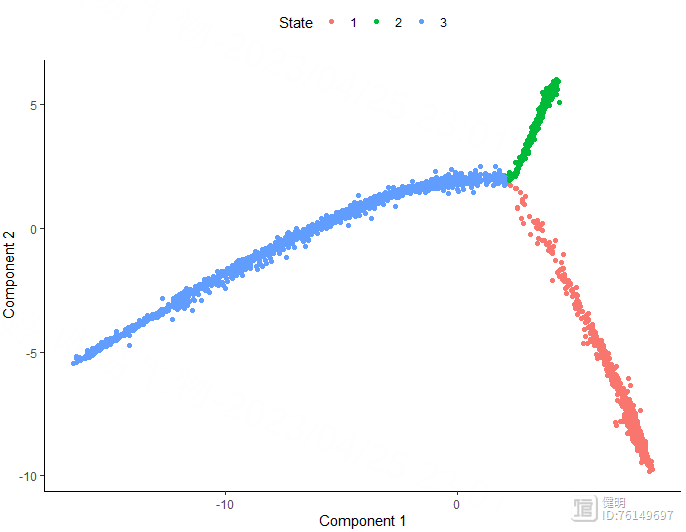
1.7 细胞通讯
library(CellChat)library(patchwork)
library(Seurat)
library(dplyr)
library(ggalluvial)
library(NMF)
options(stringsAsFactors = FALSE)
rm(list = ls())
gc()
sce <- readRDS('step3_sce.rds')
# Step1.创建cellchat对象
data.input <- sce@assays$RNA@data
meta.data <- sce@meta.data
cellchat <- createCellChat(object=data.input,
meta = meta.data,
group.by='singleR_label')
cellchat <- addMeta(cellchat,meta = meta.data)
# Step2.加载CellChatDB数据库
cellchatDB <- CellChatDB.human
cellchat@DB <- cellchatDB
# Step3.处理表达数据
cellchat <- subsetData(cellchat)
cellchat <- identifyOverExpressedGenes(cellchat)
cellchat <- identifyOverExpressedInteractions(cellchat)
# Step4.计算通讯概率,推断细胞通讯网络 这一步很耗时
cellchat <- computeCommunProb(cellchat,population.size = F)
cellchat <- filterCommunication(cellchat,min.cells = 10)
# Step5. 提取预测的细胞通讯网络为data frame
df.net <- subsetCommunication(cellchat)
df.pathway <- subsetCommunication(cellchat,slot.name = 'netP')
# Step6. 在信号通路水平推断细胞通讯
cellchat <- computeCommunProbPathway(cellchat)
# Step7. 计算加和的cell-cell通讯网络
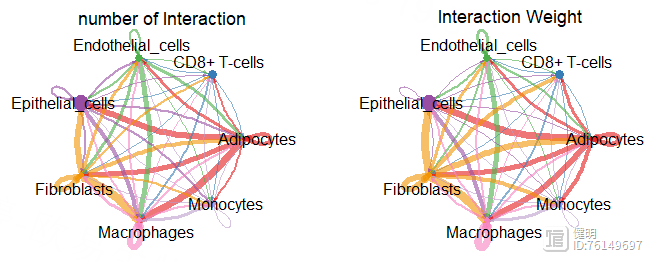
cellchat <- aggregateNet(cellchat)
par(mfrow = c(1,2))
netVisual_circle(cellchat@net$count,vertex.weight = groupSize,
weight.scale = T,label.edge = F,
title.name = 'number of Interaction')
netVisual_circle(cellchat@net$weight,vertex.weight = groupSize,
weight.scale = T,label.edge = F,
title.name = 'Interaction Weight')
mat <- cellchat@net$weight
par(mfrow = c(3,3),xpd=T)
for (i in 1:nrow(mat)){
mat2 <- matrix(0,nrow = nrow(mat),ncol = ncol(mat),
dimnames = dimnames(mat))
mat2[i,] <- mat[i,]
netVisual_circle(mat2,vertex.weight = groupSize,
weight.scale = T,edge.weight.max = max(mat),
title.name = rownames(mat)[i])
}
# Step8. 使用层次图(Hierarchical plot),圆圈图(Circle plot)或和弦图(Chord diagram)可视化每个信号通路
cellchat@netP$pathways
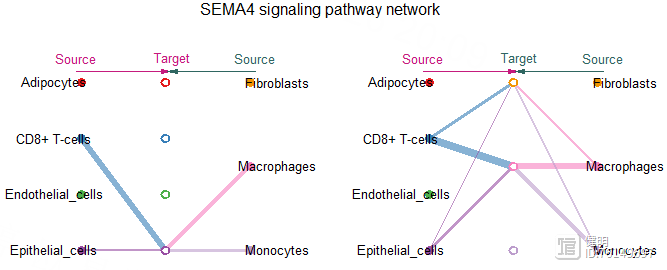
pathway.show <- c('SEMA4')
vertex.receiver <- c(1,2,3,4)
netVisual_aggregate(cellchat,signaling = pathway.show,
vertex.receiver = vertex.receiver,
layout = 'hierarchy')
par(mfrow=c(1,2),xpd=T)
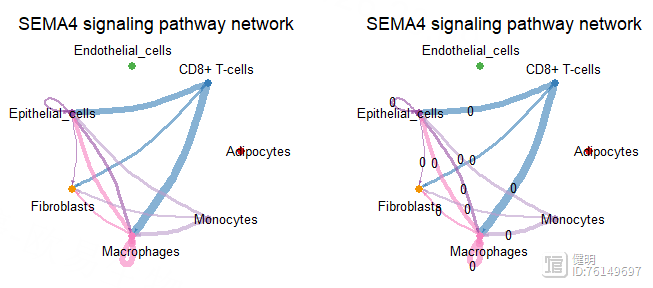
netVisual_aggregate(cellchat,signaling = pathway.show,
layout = 'circle')
netVisual_aggregate(cellchat,signaling = pathway.show,
layout = 'circle',label.edge=T)
pairLR.CXCL <- extractEnrichedLR(cellchat,signaling = pathway.show,
geneLR.return = F)
LR.show <- pairLR.CXCL[1,]
netVisual_individual(cellchat,signaling = pathway.show,
pairLR.use = 'SEMA4A_PLXNB2',
layout = 'circle')
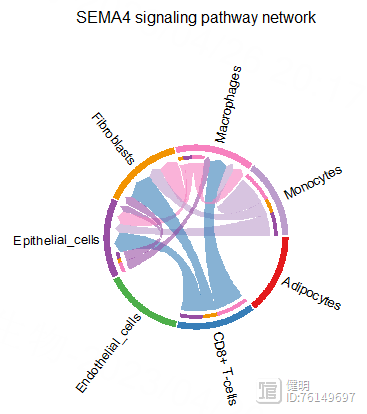
netVisual_aggregate(cellchat,signaling = pathway.show,layout = 'chord',
title.name = "Chord diagram 1")

Step 2. TCGA差异分析
library(TCGAbiolinks)library(SummarizedExperiment)
library(AnnoProbe)
library(stringr)
library(limma)
library(tinyarray)
library(data.table)
library(ggplot2)
library(dplyr)
library(tibble)
library(pheatmap)
library(clusterProfiler)
library(org.Hs.eg.db)
rm(list = ls())
# 下载LUAD表达矩阵
query <- GDCquery(project = 'TCGA-LUAD',
data.category = 'Transcriptome Profiling',
data.type = 'Gene Expression Quantification',
workflow.type = 'STAR - Counts')
GDCdownload(query)
dat <- GDCprepare(query)
exp <- assay(dat)
save(exp,file='TCGA_LUAD_exp.Rdata')
# 下载LUAD临床信息
query <- GDCquery(project = 'TCGA-LUAD',
data.category = 'Clinical',
data.type = 'Clinical Supplement',
file.type = 'xml')
GDCdownload(query)
dat <- GDCprepare_clinic(query,clinical.info = 'patient')
k = apply(dat, 2, function(x){!all(is.na(x))});table(k)
clinical <- dat[,k]
save(clinical,file = 'TCGA_LUAD_Clinical.Rdata')
注意一下TCGA的样本命名含义:
以这个为例:TCGA-A6-6650-01A-11R-1774-07
A6:Tissue source site,组织来源编码
6650:Participant, 参与者编号
01:Sample, 编号01~09表示肿瘤,10~19表示正常对照
A:Vial, 在一系列患者组织中的顺序,绝大多数样本该位置编码都是A;
很少数的是B,表示福尔马林固定石蜡包埋组织,已被证明用于测序分析的效果不佳,所以不建议使用-01B的样本数据
11:Portion, 同属于一个患者组织的不同部分的顺序编号,同一组织会分割为100-120mg的部分,分别使用
R:RNA, 分析的分子类型,对应关系如下所示:
1774:Plate, 在一系列96孔板中的顺序,值大表示制板越晚
07:Center, 测序或鉴定中心编码
# count 转换成TPM
gene_length <- fread('gene_len.txt')
colnames(gene_length) <- c('id','length')
gene_length <- as.data.frame(gene_length)
gene_length <- gene_length[!duplicated(gene_length$id),]
exp <- as.data.frame(exp)
exp$id <- unlist(lapply(rownames(exp),function(x){str_split(x,'\\.',simplify = T)[,1]}))
merge <- left_join(x=exp,y=gene_length,by='id')
merge <- na.omit(merge)
merge <- merge[!duplicated(merge$id),]
rownames(merge) <- merge$id
merge <- merge[,-601]
# 计算TPM
kb <- merge$length / 1000
rpk <- merge[,-601] / kb
tpm <- t(t(rpk) / colSums(rpk) * 1E6)
exp <- tpm
采用limma做差异分析,先把counts转换成TPM。不转也可以用DEseq2做差异分析。gene_length是每个基因的长度,这个文件是把gtf文件中,基因的终止位置-起始位置得到的。

# 更改行名:ENSEMBL -> SYMBOL
a <- annoGene(str_split(rownames(exp),'\\.',simplify = T)[,1],'ENSEMBL')
a <- a[!duplicated(a$ENSEMBL),]
rownames(a) <- a$ENSEMBL
rownames(exp) <- a[str_split(rownames(exp),'\\.',simplify = T)[,1],'SYMBOL']
# 给样本分组 tumor/normal
group <- ifelse(sapply(str_split(colnames(exp),'-',simplify = T)[,4],function(x){as.integer(substr(x,1,2))})>=10,
'normal','tumor')
sample_group <- data.frame(sample=colnames(exp),group=group)
a是annoGene函数返回的一个ID转换的结果,是一个dataframe,多个ENSEMBL ID可能对应同一个SYMBOL ID,对symbol去重后,再映射成exp的行名。

按照TCGA名字中第四部分,把样本分成tumor和normal


# 过滤
# 1. 去除FFPE样本
sample_group$sample_type <- ifelse(sapply(str_split(colnames(exp),'-',simplify = T)[,4],function(x){substr(x,3,3)})=='A',
'tissue','ffpe')
exp <- exp[,sample_group$sample_type!='ffpe']
sample_group <- sample_group[sample_group$sample_type=='tissue',]
# 2. 保留在一半以上样本中有值的gene
exp <- exp[rowSums(exp>0)>as.integer(ncol(exp)/2),]
dim(exp)
save(exp,file = 'TCGA_LUAD_TPM_exp.Rdata')
FFPE样本无论做测序还是蛋白组,代谢组,效果都不怎么好
# 对表达矩阵取log2
for (i in 1:ncol(exp)){
exp[,i] <- log2(exp[,i] 0.0001)
}

# 差异筛选
design <- model.matrix(~factor(sample_group$group,levels = c('tumor','normal')))
fit <- lmFit(exp,design = design)
fit <- eBayes(fit)
deg <- topTable(fit, coef = 2,number = Inf)
deg$change <- ifelse((deg$logFC>log2(2))&(deg$adj.P.Val<0.05),'up',
ifelse((deg$logFC<log2(0.5))&(deg$adj.P.Val<0.05),'down','nochange'))
deg <- na.omit(deg)
table(deg$change)


做完差异筛选,有10个gene含空值,删去有空值的行即可。更新下exp并保存好
# deg比exp少了几个gene
exp <- exp[intersect(rownames(exp),deg$ID),]
save(exp,file = 'TCGA_exp.Rdata')
save(deg,file = 'TCGA_DEGS.Rdata')
# volcano plot
ggplot(deg,aes(x=deg$logFC,y=-log10(deg$adj.P.Val),color=change))
geom_point()
geom_hline(yintercept = -log10(0.05),linetype=2,linewidth=1)
geom_vline(xintercept = log2(0.5),linetype=2,linewidth=1)
geom_vline(xintercept = log2(2),linetype=2,linewidth=1)
scale_color_manual(values=c('blue','gray','red'))
# heatmap
deg_heatmap <- deg[order(deg$logFC,decreasing = T),]
deg_gene <- deg_heatmap[deg_heatmap$change!='nochange','ID']
heatmap_deg_gene <- as.data.frame(exp)[deg_gene,]
heatmap_deg_gene <- na.omit(heatmap_deg_gene)
anno_col <- data.frame(group=sample_group$group)
rownames(anno_col) <- sample_group$sample
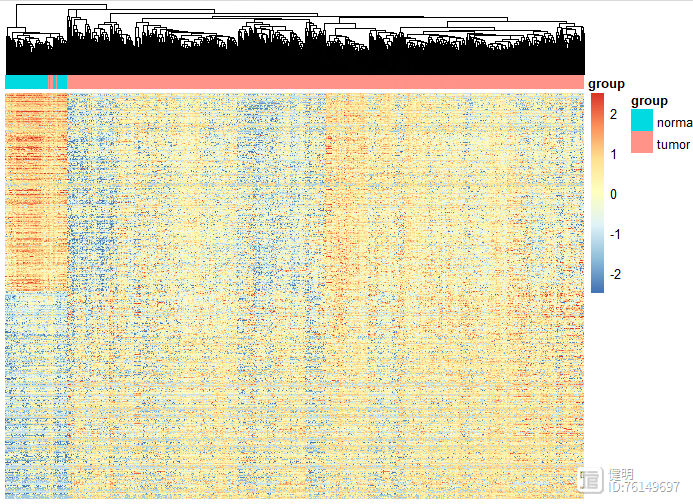
pheatmap(heatmap_deg_gene,show_rownames = F,cluster_rows = F,scale = 'row',
show_colnames = F,annotation_col=anno_col ,
breaks = seq(-2.5,2.5,length.out=100))
dim(heatmap_deg_gene)
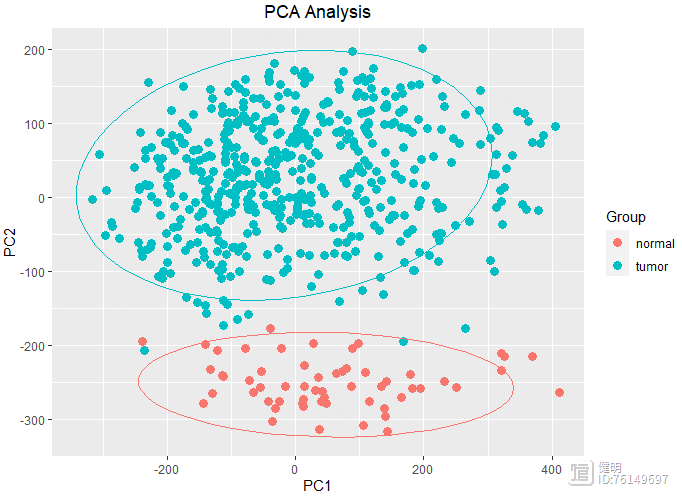
# pca plot
exp <- as.data.frame(exp)
pca <- prcomp(t(exp))
ggplot(data.frame(pca$x),aes(x=PC1,y=PC2,color=sample_group$group))
geom_point(size = 3) stat_ellipse(level = 0.95, show.legend = F)
labs(title = 'PCA Analysis')
theme(plot.title = element_text(hjust = 0.5))
guides(color = guide_legend(title = 'Group'))

# GO enrich
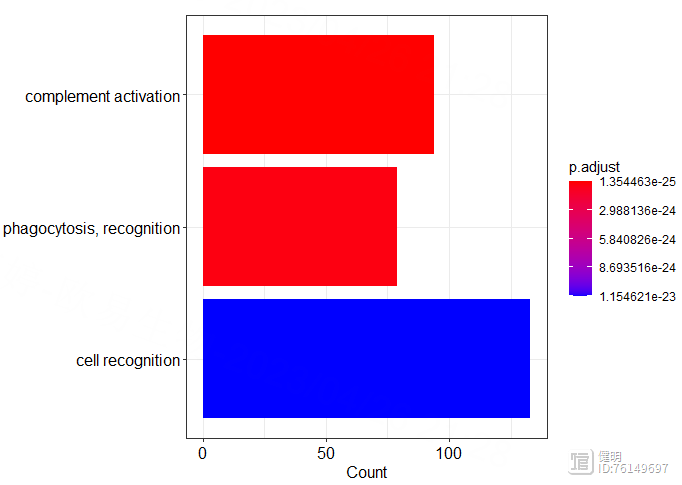
go_bp <- enrichGO(deg_gene,org.Hs.eg.db,'SYMBOL','BP')
go_mf <- enrichGO(deg_gene,org.Hs.eg.db,'SYMBOL','MF')
go_cc <- enrichGO(deg_gene,org.Hs.eg.db,'SYMBOL','CC')
dotplot(go_bp)
barplot(go_bp,showCategory = 4)
# KEGG enrich
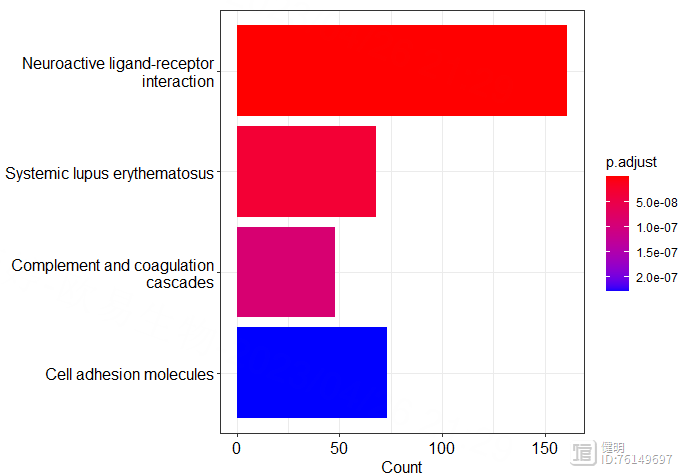
entrez_id <- bitr(deg_gene,fromType = 'SYMBOL',toType = 'ENTREZID',OrgDb = org.Hs.eg.db)
kegg <- enrichKEGG(entrez_id$ENTREZID,organism = 'hsa',keyType = 'ncbi-geneid')
dotplot(kegg)
barplot(kegg,showCategory = 4)
Step 3. WGCNA分析
library(WGCNA)library(reshape2)
library(stringr)
library(dplyr)
library(patchwork)
library(ggplot2)
rm(list = ls())
gc()
load('TCGA_DEGS.Rdata')
load('TCGA_exp.Rdata')
load('TCGA_LUAD_Clinical.Rdata')
options(stringsAsFactors = F) # 开启多线程
enableWGCNAThreads()
# 1. 数据处理
# >>> 选取表达量前10000的gene,用全部gene的话,计算后面的邻接矩阵和TOM矩阵太慢了
temp <- as.data.frame(exp)
temp$avg_exp <- rowMeans(temp)
temp <- temp[order(temp$avg_exp,decreasing = T),]
top10000_gene <- rownames(temp[1:10000,])
exp <- as.data.frame(exp[top10000_gene,])
# >>> 查找并删除异常值
temp <- exp
colnames(temp) <- 1:ncol(exp)
plot(hclust(dist(t(temp)))) # 没有异常样本

# 2. 构建基因共表达网络
exp <- as.data.frame(t(exp))
# >>> 2.1 选择合适的power
power_vec <- c(seq(1, 10, by = 1), seq(12, 20, by = 2))
sft <- pickSoftThreshold(exp,powerVector = power_vec)
a <- ggplot(sft$fitIndices,aes(x=Power,y=-sign(slope)*SFT.R.sq))
geom_text(label=sft$fitIndices$Power,color='red')
geom_hline(yintercept = 0.9,color='red')
xlab("Soft Threshold (power)") ylab("Scale Free Topology Model Fit,signed R^2")
ggtitle("Scale independence") theme(plot.title = element_text(hjust = 0.5))
b <- ggplot(sft$fitIndices,aes(x=Power,y=mean.k.))
geom_text(label=sft$fitIndices$Power,color='red')
xlab("Soft Threshold (power)") ylab("Mean Connectivity")
ggtitle('Mean connectivity') theme(plot.title = element_text(hjust = 0.5))
a b

这里power=12,达到0.8即可
power <- sft$powerEstimate
# >>> 2.2 检验所选power是否符合无尺度网络
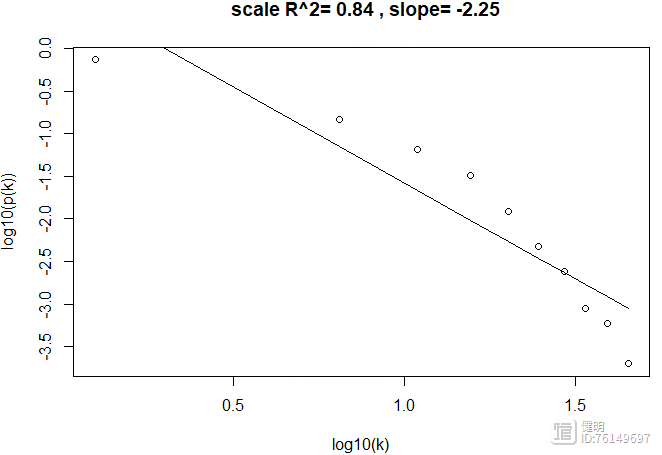
k <- softConnectivity(exp,power = power)
scaleFreePlot(k)
power=12确实也符合无尺度网络,R2较高
# >>> 2.3 计算gene在sample间的corr或者distance,构建临近矩阵。默认用dist函数计算(欧氏距离)
adj <- adjacency(exp,power = power)
# >>> 2.4 根据临近矩阵计算TOM(拓扑重叠矩阵)
TOM <- TOMsimilarity(adj)
# >>> 2.5 计算gene间相异性
dissTOM <- 1-TOM
# 3. 对gene进行聚类并可视化
geneTree <- hclust(as.dist(dissTOM),method = 'average')
sizeGrWindow(12,9)
plot(geneTree, xlab="", sub="", main = "Gene clustering on TOM-based dissimilarity",
labels = FALSE, hang = 0.04)
# >>> 3.2 将gene聚类树进行修剪后,把gene归到不同的模块里
dynamic_modules <- cutreeDynamic(dendro = geneTree,distM = dissTOM,minClusterSize = 50,
deepSplit = 2,pamRespectsDendro=F,minSplitHeight = NULL)
table(dynamic_modules)
module_color <- labels2colors(dynamic_modules)
plotDendroAndColors(geneTree,module_color,dendroLabels = F,hang=0.03,addGuide = T,
guideHang = 0.05,groupLabels='Dynamic color tree',
main='gene dendrogram and module colors')

# >>> 3.3 计算每个模块的特征基因向量(对每个模块的gene表达量降维后,只保留PC1,即MEs)
MEList <- moduleEigengenes(exp,colors = dynamic_modules)
MEs <- MEList$eigengenes
# >>> 3.4 计算特征基因的相异度,基于相异度对原有模块进行层次聚类
dissME <- 1-cor(MEs)
MEtree <- hclust(as.dist(dissME),method = 'average')
plotEigengeneNetworks(MEs,
"Eigengene adjacency heatmap",
marHeatmap = c(3,4,2,2),
plotDendrograms = FALSE,
xLabelsAngle = 90)
# >>> 3.5 如果模块太多,可以对模块进行合并.设置剪切高度,剪切高度以下的模块进行合并
cut_height <- 0.2
sizeGrWindow(8,6)
plot(MEtree,main = "Clustering of module eigengenes",
xlab = "", sub = "")
abline(h=cut_height,col='red')
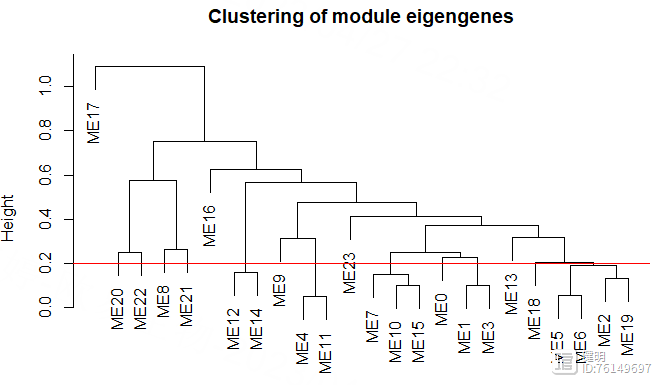
把高度0.2以下的模块进行合并,再看看合并前后模块的变化
module_merge <- mergeCloseModules(exp,module_color,cutHeight = cut_height)
merged_color <- module_merge$colors
merged_MEs <- module_merge$newMEs
sizeGrWindow(8,6)
plotDendroAndColors(geneTree,cbind(module_color,merged_color),dendroLabels = F,hang=0.03,
addGuide = T,groupLabels = c("Dynamic Tree Cut", "Merged dynamic"))

# 4. 计算每个模块与临床信息的相关性、pvalue。找出与临床信息相关性高的模块
nGenes <- ncol(exp)
nSamples <- nrow(exp)
################################准备临床信息####################################
clinical <- clinical[,c('bcr_patient_barcode','gender','residual_tumor')]
traits <- data.frame(row.names = rownames(exp),ID=rownames(exp))
traits$ID <- substr(traits$ID,1,12)
index <- match(traits$ID,clinical$bcr_patient_barcode)
traits$gender <- as.numeric(as.factor(clinical[index,'gender']))
traits$residual_tumor <- as.numeric(as.factor(clinical[index,'residual_tumor']))
traits$type <- ifelse(sapply(str_split(rownames(traits),'-',simplify = T)[,4],
function(x){as.integer(substr(x,1,2))})>=10,'normal','tumor')
traits$type <- as.numeric(as.factor(traits$type))
traits <- traits[,-1]
################################准备临床信息####################################
clinical是前面下载的TCGA临床数据,这里随便取了两个比较关心的临床信息。clinical的每一行是一个病人的ID,而表达矩阵每一行是一个样本,一个病人身上可能有多个样本。在把临床信息和表达矩阵一一对应的时候,如果直接把exp的行名取前12位,就会产生重复值。在做的时候,先准备好样本和病人ID的对应关系,再把clinical里病人的信息给匹配过来

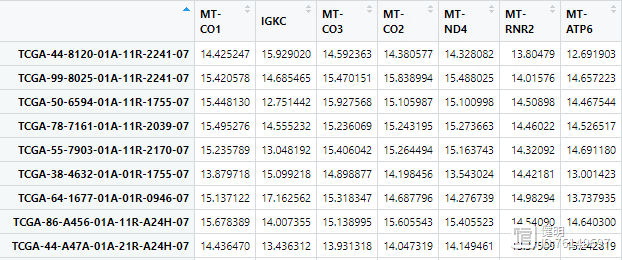
最终的临床信息是这样,要把字符串变成数值型变量

module_trait_cor <- cor(merged_MEs,traits,use = 'p')
module_trait_pvalue <- corPvalueStudent(module_trait_cor,nSamples)
trait_colors <- numbers2colors(traits,signed = T,centered = T)
a <- paste(signif(module_trait_cor, 2), "\n(", signif(module_trait_pvalue, 1), ")", sep = "")
sizeGrWindow(8,6)
labeledHeatmap(module_trait_cor,xLabels = colnames(traits),yLabels = colnames(merged_MEs),colorLabels = FALSE,
colors = blueWhiteRed(50),textMatrix = a,
setStdMargins = FALSE,cex.text = 0.65,zlim = c(-1,1),
main = paste("Module-trait relationships"))
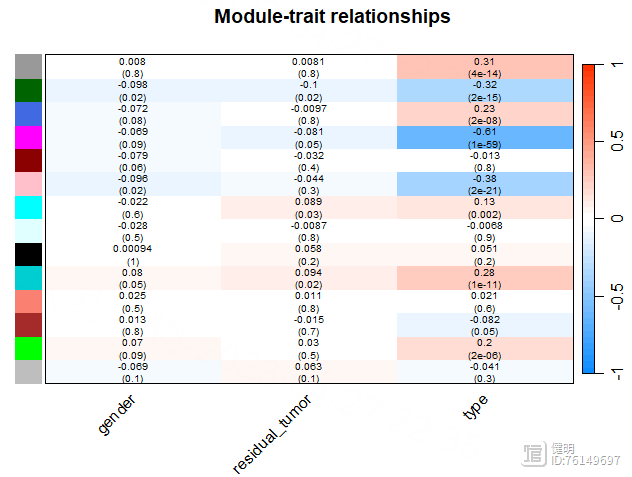
模块与tumor/normal之间的相关性并不是很高。。。。。就拿粉色模块当做感兴趣的模块吧
# 5. 找出感兴趣的模块内的枢纽gene
# >>> 5.1 计算gene表达量与临床性状的相关性
gs <- apply(exp,2,function(x){cor(x,traits$type)})
# >>> 5.2 基于网络计算gene与临床性状的相关性
ns <- networkScreening(y=traits$type,datME = merged_MEs,datExpr = exp)
# >>> 5.3 计算每个gene与特征gene的相关性
kme <- signedKME(datExpr = exp,datME = merged_MEs)
# >>> 5.4 根据gs, ns, kme 找出hub gene
hubgene_filter <- (gs>0.2 & ns$q.Weighted<0.01 & abs(kme$kMEmagenta)>0.4)
hub_gene <- colnames(exp)[hubgene_filter]
plotNetworkHeatmap(exp,
plotGenes = hub_gene,
networkType = "unsigned",
useTOM = TRUE,
power=8,
main="unsigned correlations")
看下kme,其中粉色模块里,gene的相关性并不是很高,这里筛选了>0.4的,最后找到25个hub gene。如果阈值再设高一点,hub gene就全卡掉了。。。这跟没有用所有的3w多个gene去计算有关,也跟一些参数有关,我没有一个个去调整优化,只是展示一下如何做图和分析思路


hub_gene <- intersect(hub_gene,deg$ID)
save(hub_gene,file = 'TCGA_WGCNA_hub_gene.Rdata')
最后找出hub gene和前面deg的交集部分,作为hub gene,存档
Step 4. 非负矩阵分解算法
4.1 NMF算法对样本分类
library(NMF)library(survival)
library(stringr)
library(data.table)
library(survminer)
library(dplyr)
library(AnnoProbe)
library(CIBERSORT)
library(tidyr)
library(tibble)
library(RColorBrewer)
library(ggalluvial)
library(ggplot2)
options(stringsAsFactors = F)
rm(list = ls())
gc()
load('TCGA_LUAD_TPM_exp.Rdata')
load('TCGA_DEGS.Rdata')
load('TCGA_WGCNA_hub_gene.Rdata')
dim(exp)
# 对表达矩阵取log2
exp <- log2(exp 1)
ranks <- seq(2,10)
hubgene_exp <- exp[hub_gene,]
estimate <- nmf(hubgene_exp,2:10,nrun=50,method = 'brunet')
plot(estimate)
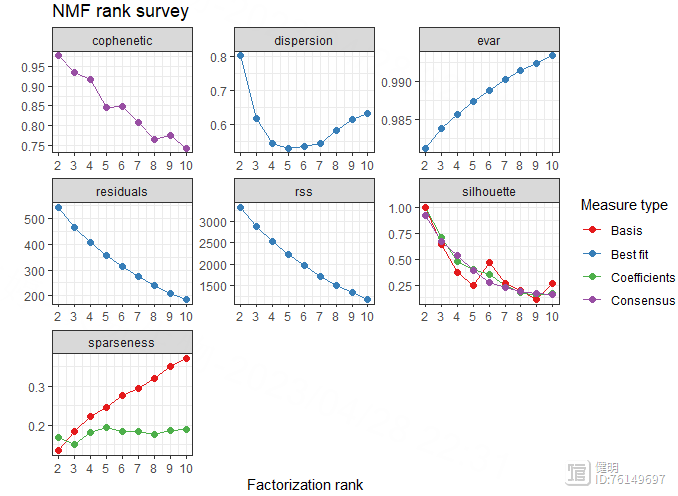
注意hubgene_exp里不能有负数,不然会报错,rank为2时,波动最大
rank <- 2
nmf.rank4 <- nmf(hubgene_exp,rank,nrun=50,method = 'brunet')
index <- extractFeatures(nmf.rank4,'max')
index <- unlist(index)
nmf.exp <- hubgene_exp[index,]
nmf.exp <- na.omit(nmf.exp)
group <- predict(nmf.rank4)
jco <- c("#2874C5","#EABF00","#C6524A","#868686")
consensusmap(nmf.rank4,labRow=NA,labCol=NA,
annCol = data.frame("cluster"=group[colnames(nmf.exp)]),
annColors = list(cluster=c("1"=jco[1],"2"=jco[2],"3"=jco[3],"4"=jco[4])))
cluster_df <- data.frame(row.names = colnames(exp),ID=substr(colnames(exp),1,12),cluster=group)
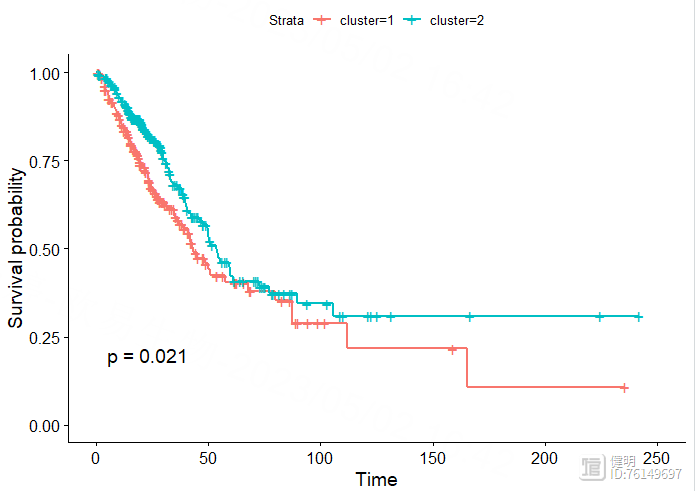
NMF算法把所有样本分成两类,顺便看下最后的clueter_df
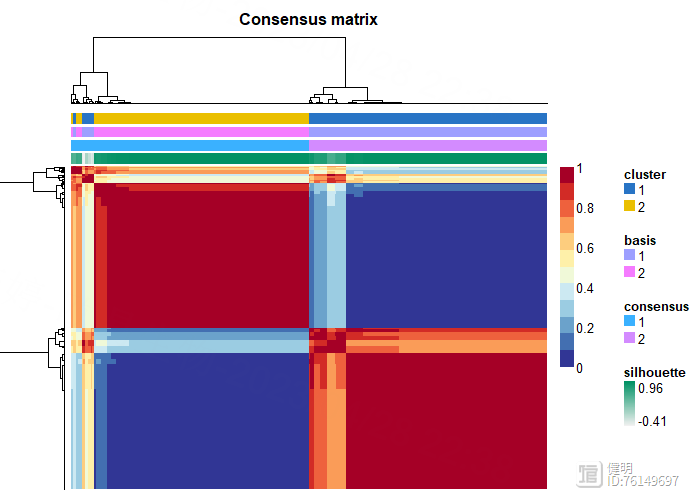
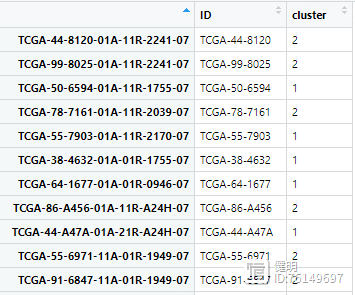
4.2 生存分析
load('TCGA_LUAD_TPM_exp.Rdata')load('TCGA_LUAD_Clinical.Rdata')
# 1. 取log(TPM)
for (i in 1:ncol(exp)){
exp[,i] <- log2(exp[,i] 0.0001)
}
# 2. 以病人为中心,去重
exp <- as.data.frame(exp)
exp <- exp[,sort(colnames(exp))]
index <- !duplicated(substr(colnames(exp),1,12))
exp <- exp[,index]

# 3.读取从xena下载的生存数据
sur <- fread('TCGA-LUAD.survival.tsv')
sur <- as.data.frame(sur)
patient_id <- substr(colnames(exp),1,12)
clin <- data.frame(row.names = patient_id,ID=patient_id)
index <- match(clin$ID,sur[,'_PATIENT'])
clin <- cbind(clin,sur[index,c('OS','OS.time')])
clin <- na.omit(clin)
index2 <- match(clin$ID,clinical$bcr_patient_barcode)
clin <- cbind(clin,clinical[index2,'gender'])
colnames(clin) <- c(colnames(clin)[1:ncol(clin)-1],'gender')
clin$gender <- as.numeric(as.factor(clin$gender))


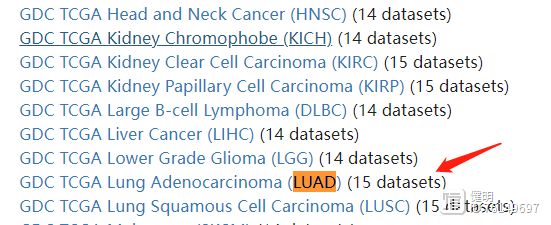
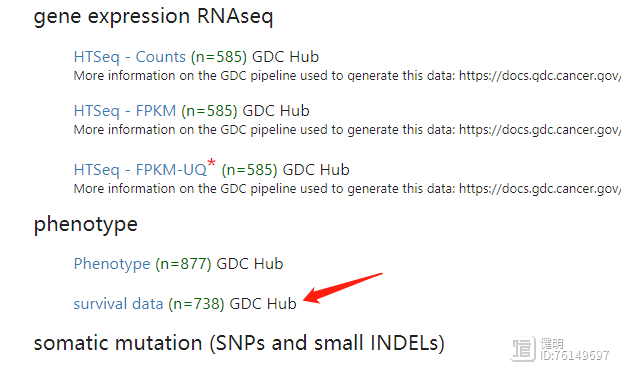
下载下来的生存数据长这样
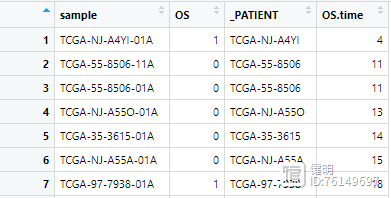
之前从TCGA下载的临床数据长这样
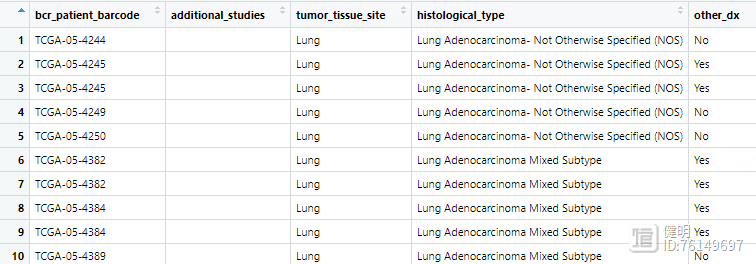
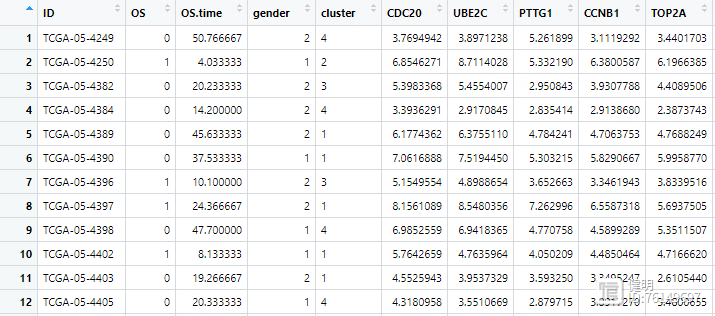
合并后的clin是这样,所有变量类型都要转成数值型
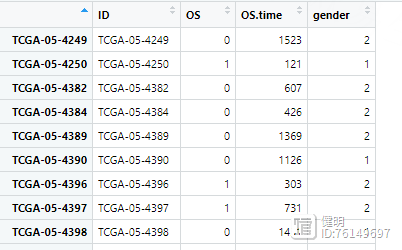
# 合并NMF结果
cluster_type_group <- ifelse(sapply(str_split(rownames(cluster_df),'-',simplify = T)[,4],
function(x){as.integer(substr(x,1,2))}
)>=10,
'normal','tumor')
cluster_df <- cluster_df[which(cluster_type_group=='tumor'),]
clin <- left_join(clin,cluster_df,'ID',multiple='first')
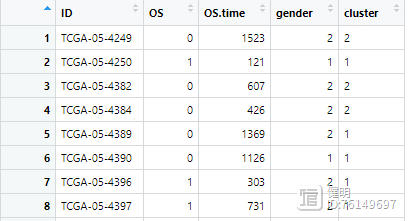
再把NMF分类的结果添加进来,就是cluster那一列
# 7. 过滤生存数据,不要<30天的,再把天数转换成月
clin <- clin[clin$OS.time>30,]
clin$OS.time <- clin$OS.time / 30
# 8. exp的列名和临床信息的行名一一对应。NMF将样本分成若干个亚型,画出亚型的生存曲线
colnames(exp) <- substr(colnames(exp),1,12)
index <- match(clin$ID,colnames(exp))
exp <- exp[,index]
sfit <- survfit(Surv(OS.time,OS)~cluster,data=clin)
ggsurvplot(sfit,pval = T)
save(clin,file = 'clin.Rdata')
4.3 免疫浸润
my_pallet <- colorRampPalette(brewer.pal(8,'Set1'))lm22f = system.file("extdata", "LM22.txt", package = "CIBERSORT")
cluster1 <- exp[,rownames(cluster_df[cluster_df$cluster==1,])]
cluster2 <- exp[,rownames(cluster_df[cluster_df$cluster==2,])]
TME.result1 <- cibersort(lm22f,as.matrix(cluster1),perm = 100,QN=T) # 耗时很久
TME.result2 <- cibersort(lm22f,as.matrix(cluster2),perm = 100,QN=T)
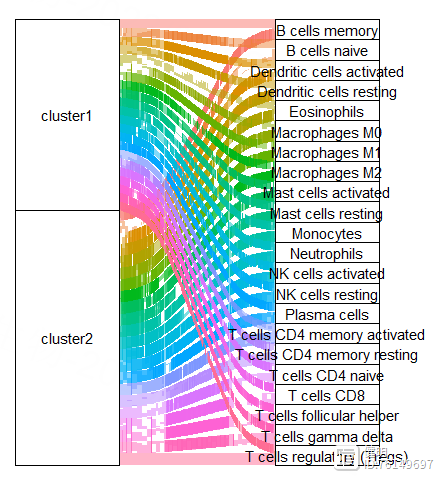
原文中免疫浸润用MCPcounter做的,这里我用CIBERSORT做,运行完的结果就是各种免疫细胞在每个样本中的含量

result1 <- TME.result1[,-c(23:25)] %>% as.data.frame() %>%
rownames_to_column('Sample') %>% gather(key = cell_type,value = proportion,-Sample)
result2 <- TME.result2[,-c(23:25)] %>% as.data.frame() %>%
rownames_to_column('Sample') %>% gather(key = cell_type,value = proportion,-Sample)
result1$cluster <- rep('cluster1', times=nrow(result1))
result2$cluster <- rep('cluster2', times=nrow(result2))
dat <- rbind(result1,result2)
ggplot(dat,aes(axis1 = cluster, axis2 = cell_type))
geom_alluvium(aes(fill = as.factor(cell_type)),width = 2/5, discern = FALSE)
geom_stratum(width = 2/5, discern = FALSE)
geom_text(stat = "stratum", discern = FALSE,aes(label = after_stat(stratum)))
theme(legend.position = "none",#去除刻度线和背景颜色
panel.background = element_blank(),
axis.ticks = element_blank(),
axis.text.y = element_blank(),
axis.text.x = element_text(size =15,colour = "black"),#坐标轴名
axis.title = element_blank())
scale_x_discrete(position = "top")
把上面的透视表转换成长表,添加上cluster的信息,再把cluster1和cluster2对应的长表合并起来,就可以画图了
cell <- 'Plasma cells'
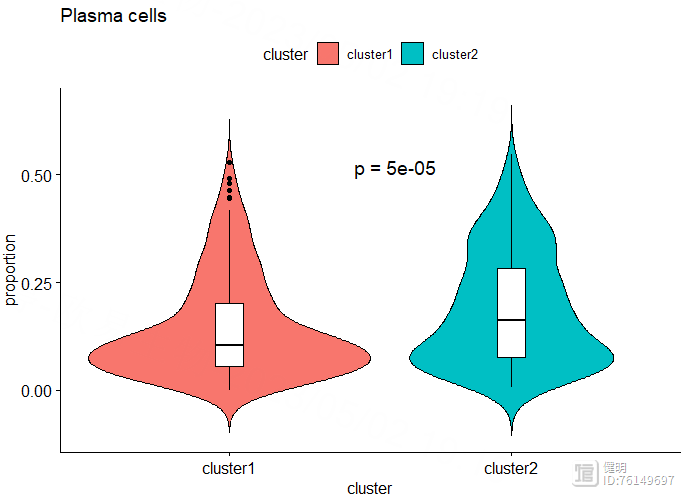
ggviolin(dat[dat$cell_type==cell,],x='cluster',y='proportion',fill = 'cluster',
add = 'boxplot',add.params = list(fill = 'white',width=0.1,linetype=1),title = cell)
stat_compare_means(method = 't.test',label = 'p.format',aes(label = 'p.format'),
label.x.npc = 'center',label.y = 0.5,size=5)
4.4 批量单因素Cox回归
load('TCGA_WGCNA_hub_gene.Rdata')load('TCGA_LUAD_TPM_exp.Rdata')
load('clin.Rdata')
hubgene_exp <- exp[hub_gene,]
hubgene_exp <- as.data.frame(t(hubgene_exp))
hubgene_exp$ID <- substr(rownames(hubgene_exp),1,12)
clin <- left_join(clin,hubgene_exp,by='ID')
把WGCNA中找到的hub gene挑出来,拿到他们在所有样本中的表达值。把表达值和生存信息合并到一起,最后的clin长这样。在合并之前要注意,删掉normal样本,我这里没有做。
res.cox <- coxph(Surv(OS.time,OS)~SAPCD2,data=clin)
sumres.cox <- summary(res.cox)
挑一个基因SAPCD2做单因素cox回归,最后需要的信息都藏在sumres.cox里
# 批量单因素cox回归
gene <- c()
p_value <- c()
HR <- c()
lower95 <- c()
upper95 <- c()
for (i in 6:ncol(clin)){
res <- coxph(Surv(OS.time,OS)~clin[,i],data=clin)
sum_res <- summary(res)
p <- sum_res$coefficients[,'Pr(>|z|)']
if (p<0.05){
gene <- c(gene,colnames(clin)[i])
p_value <- c(p_value,p)
HR <- c(HR,sum_res$conf.int[,'exp(coef)'])
lower95 <- c(lower95,sum_res$conf.int[,'lower .95'])
upper95 <- c(upper95,sum_res$conf.int[,'upper .95'])
}
}
cox_df <- data.frame(row.names = gene,pvalue=p_value,HR=HR,lower.95=lower95,upper.95=upper95)
lasso_input_gene <- rownames(cox_df[cox_df$pvalue<0.01,])
save(lasso_input_gene,file = 'Lasso_input_gene.Rdata')
批量单因素cox回归得到每个gene的pvalue,挑出pvalue<0.01的再进行后续筛选
Step 5. 预后模型构建和验证
load('Lasso_input_gene.Rdata')load('TCGA_LUAD_TPM_exp.Rdata')
load('clin.Rdata')
# 对表达矩阵取log2
exp <- log2(exp 0.00001)
exp <- as.data.frame(exp)
# Lasso回归进一步筛选gene
exp2 <- exp[lasso_input_gene,]
exp2 <- as.data.frame(t(exp2))
exp2$ID <- substr(rownames(exp2),1,12)
exp2 <- exp2[!duplicated(exp2$ID),]
clin <- clin[,1:3]
exp3 <- left_join(clin,exp2,by='ID')
rownames(exp3) <- exp3$ID
exp3 <- exp3[,-1]
exp3 <- na.omit(exp3)
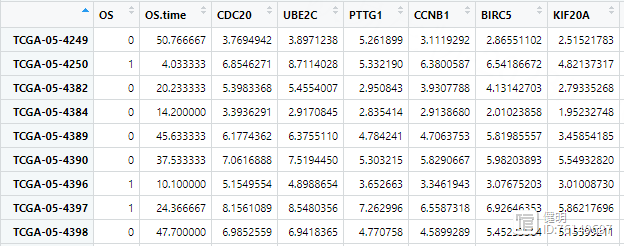
exp3是生存数据和上一步批量单因素Cox回归筛选出来的基因的表达量合并起来的结果
x <- as.matrix(exp3[,3:(ncol(exp3)-1)])
y <- Surv(exp3$OS.time,exp3$OS)
fit1 <- glmnet(x,y,alpha = 1,family = 'cox')
plot(fit1)
cv_fit <- cv.glmnet(x,y,alpha = 1,nfolds = 10,family="cox")
plot(cv_fit)
best_lambda <- cv_fit$lambda.min
fit2 <- glmnet(x,y,lambda = best_lambda,alpha = 1,family = 'cox')
lasso_filter_gene <- names(fit2$beta[fit2$beta[,1]!=0,1])
由于之前筛选出来的gene效果不怎么好, 经过lasso过滤后,只剩2个gene了,就用这两个来做多因素cox回归
# 多因素cox回归构建预后模型
exp4 <- exp3 %>% dplyr::select(OS,OS.time,lasso_filter_gene)
multicox <- coxph(Surv(OS.time,OS)~.,data = exp4)
sum_multicox <- summary(multicox)
riskScore <- predict(multicox,type = 'risk',newdata = exp4)
riskScore <- as.data.frame(riskScore)
riskScore$ID <- rownames(riskScore)
riskScore$risk <- ifelse(riskScore$riskScore>median(riskScore$riskScore),'high','low')
做完多因素回归后,计算每个样本的riskscore,用riskScore把样本分成两类
# KM plot
km_data <- left_join(riskScore,clin,by='ID')
fit <- survfit(Surv(OS.time,OS)~risk,data=km_data)
ggsurvplot(fit,data = km_data,pval = T,risk.table = T,surv.median.line = 'hv',
legend.title = 'RiskScore',title = 'Overall survival',
ylab='Cummulative survival',xlab='Time(Days)')

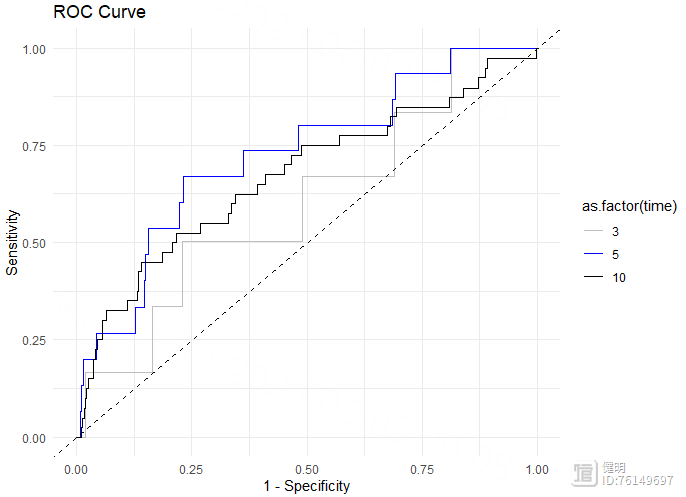
# 绘制ROC曲线
roc_data <- data.frame(x = roc$FP[,1],
y = roc$TP[,1],
time = roc$times[1])
for (i in 2:length(roc$times)) {
temp <- data.frame(x = roc$FP[,i],
y = roc$TP[,i],
time = roc$times[i])
roc_data <- rbind(roc_data, temp)
}
ggplot(roc_data, aes(x = x, y = y, color = as.factor(time)))
geom_line()
scale_color_manual(values = c("gray", "blue", "black"))
geom_abline(slope = 1, intercept = 0, linetype = "dashed")
xlab("1 - Specificity")
ylab("Sensitivity")
ggtitle("ROC Curve")
theme_minimal()
# 绘制风险图
ggrisk(multicox)

# risk score与临床病理特征的相关性
load('TCGA_LUAD_Clinical.Rdata')
clinical_df <- clinical[,c('bcr_patient_barcode','gender','stage_event_pathologic_stage')]
clinical_df <- merge(km_data,clinical_df,by.x = 'ID',by.y = 'bcr_patient_barcode')
clinical_df <- clinical_df[!duplicated(clinical_df$ID),]
clinical_df$stage_event_pathologic_stage <- case_when(clinical_df$stage_event_pathologic_stage=='Stage IA'~'Stage I',
clinical_df$stage_event_pathologic_stage=='Stage IB'~'Stage I',
clinical_df$stage_event_pathologic_stage=='Stage IIA'~'Stage II',
clinical_df$stage_event_pathologic_stage=='Stage IIB'~'Stage II',
clinical_df$stage_event_pathologic_stage=='Stage IIIA'~'Stage III',
clinical_df$stage_event_pathologic_stage=='Stage IIIB'~'Stage III',
)
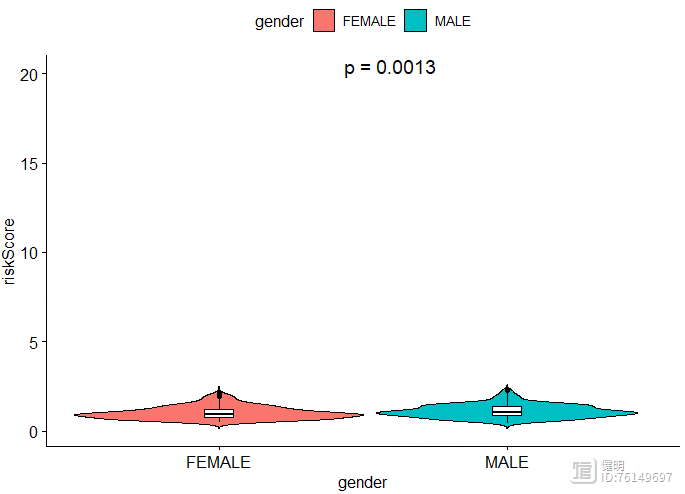
ggviolin(clinical_df,x='gender',y='riskScore',fill = 'gender',
add = 'boxplot',add.params = list(fill = 'white',width=0.1,linetype=1),)
stat_compare_means(method = 'wilcox.test',label = 'p.format',aes(label = 'p.format'),
label.x.npc = 'center',label.y = 20,size=5)
ggviolin(clinical_df,x='stage_event_pathologic_stage',y='riskScore',fill = 'stage_event_pathologic_stage',
add = 'boxplot',add.params = list(fill = 'white',width=0.1,linetype=1),)
stat_compare_means(method = 'wilcox.test',label = 'p.signif',aes(label = 'p.format'),
label.x = 1,label.y = 20,size=5)

Step 6. riskScore和临床信息的相关性
# 森林图# 批量单因素回归
df_forest <- clinical_df
df_forest$gender <- as.numeric(as.factor(df_forest$gender))
df_forest$stage_event_pathologic_stage <- as.numeric(as.factor(df_forest$stage_event_pathologic_stage))
gene <- c()
p_value <- c()
HR <- c()
lower95 <- c()
upper95 <- c()
means <- c()
for (i in c('riskScore','gender','stage_event_pathologic_stage')){
res <- coxph(Surv(OS.time,OS)~df_forest[,i],data=df_forest)
sum_res <- summary(res)
p <- sum_res$coefficients[,'Pr(>|z|)']
gene <- c(gene,i)
p_value <- c(p_value,p)
HR <- c(HR,sum_res$conf.int[,'exp(coef)'])
lower95 <- c(lower95,sum_res$conf.int[,'lower .95'])
upper95 <- c(upper95,sum_res$conf.int[,'upper .95'])
means <- c(means,res$means)
}
cox_df <- data.frame(row.names = gene,pvalue=p_value,HR=HR,lower.95=lower95,upper.95=upper95,means=means)
cox_df$pvalue <- round(cox_df$pvalue,3)
cox_df$HR <- round(cox_df$HR,3)
cox_df <- rownames_to_column(cox_df,var = 'Variable')
cox_df <- rbind(colnames(cox_df),cox_df)
forestplot(labeltext=as.matrix(cox_df)[,1:3],lower=as.numeric(cox_df[,4]),
upper=as.numeric(cox_df[,5]),mean=as.numeric(cox_df[,6]),
is.summary=c(T,F,F,F),
zero=0,lineheight=unit(0.5,'cm'),graphwidth=unit(35,'mm'),
colgap=unit(2,'mm'),lwd.zero=2,lwd.ci=3,
col=fpColors(box = '#7AC5CD',lines = 'black',zero = 'purple'),
lwd.xaxis=2,lty.ci='solid',ci.vertices.height=0.05,graph.pos=2,
xlim=c(0,2.5),box.size=0.5,
hrzl_lines=list('2'=gpar(lwd=3,columns=1:4,col='dark green'),
'5'=gpar(lwd=3,columns=1:4,col='dark green'))
)
# 多因素回归
res <- coxph(Surv(OS.time,OS)~riskScore gender stage_event_pathologic_stage,data=df_forest)
sum_res <- summary(res)
df <- data.frame(row.names = rownames(sum_res$conf.int),pvalue=sum_res$coefficients[,'Pr(>|z|)'],
HR=sum_res$conf.int[,'exp(coef)'],lower=sum_res$conf.int[,'lower .95'],
upper=sum_res$conf.int[,'upper .95'],means=res$means)
df$pvalue <- round(df$pvalue,3)
df$HR <- round(df$HR,3)
df <- rownames_to_column(df,var='Variable')
df <- rbind(colnames(df),df)
forestplot(labeltext=as.matrix(df)[,1:3],lower=as.numeric(df[,4]),
upper=as.numeric(df[,5]),mean=as.numeric(df[,6]),
is.summary=c(T,F,F,F),
zero=0,lineheight=unit(0.5,'cm'),graphwidth=unit(35,'mm'),
colgap=unit(2,'mm'),lwd.zero=2,lwd.ci=3,
col=fpColors(box = '#7AC5CD',lines = 'black',zero = 'purple'),
lwd.xaxis=2,lty.ci='solid',ci.vertices.height=0.05,graph.pos=2,
xlim=c(0,2.5),box.size=0.5,
hrzl_lines=list('2'=gpar(lwd=3,columns=1:4,col='dark green'),
'5'=gpar(lwd=3,columns=1:4,col='dark green'))
)

# GSEA
df_exp <- as.data.frame(t(exp))
df_exp <- rownames_to_column(df_exp,var = 'sample_ID')
df_exp$sample_ID <- substr(df_exp$sample_ID,1,12)
df_exp <- df_exp[!duplicated(df_exp$sample_ID),]
rownames(df_exp) <- df_exp$sample_ID
df_exp <- as.data.frame(t(df_exp[,-1]))
df_exp <- df_exp[,km_data$ID]
group <- as.factor(km_data$risk)
design <- model.matrix(~km_data$risk)
fit <- lmFit(df_exp,design)
fit <- eBayes(fit)
df_deg <- topTable(fit,coef = 2,number = Inf)
df_deg$change <- ifelse(df_deg$logFC>log2(2) & df_deg$adj.P.Val<0.05,'up',
ifelse(df_deg$logFC<log2(0.5) & df_deg$adj.P.Val<0.05,'down','nochange'))
df_deg <- df_deg[order(df_deg$logFC,decreasing = T),]
symbol_2_entrez <- bitr(rownames(df_deg),fromType = 'SYMBOL',toType = 'ENTREZID',OrgDb = org.Hs.eg.db)
symbol_2_entrez <- symbol_2_entrez[!duplicated(symbol_2_entrez$SYMBOL),]
rownames(symbol_2_entrez) <- symbol_2_entrez$SYMBOL
df_deg$entrezid <- symbol_2_entrez[rownames(df_deg),'ENTREZID']
df_deg <- df_deg[!duplicated(df_deg$entrezid),]
df_deg <- na.omit(df_deg)
a <- df_deg[(df_deg$change=='up'),'logFC']
names(a) <- df_deg[(df_deg$change=='up'),'entrezid']
res_a <- gseKEGG(a,'hsa')
b <- df_deg[(df_deg$change=='down'),'logFC']
names(b) <- df_deg[(df_deg$change=='down'),'entrezid']
res_b <- gseKEGG(b,'hsa')
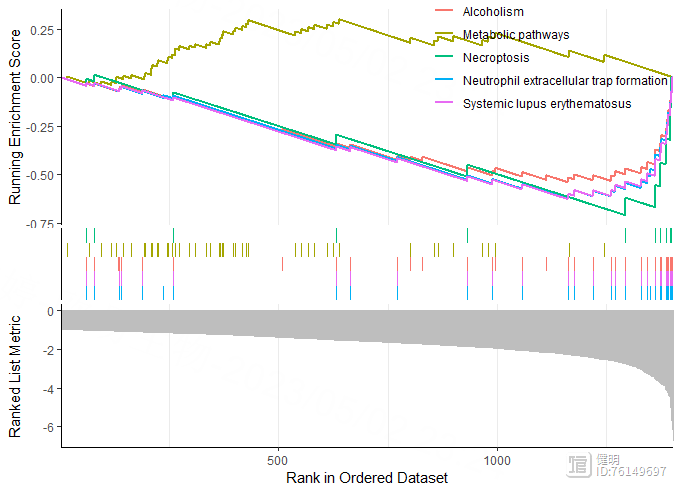
gseaplot2(res_a,geneSetID = 1:5)
gseaplot2(res_b,geneSetID = 1:5)
先做差异分析,找到high risk vs low risk的差异基因,上调和下调的gene分别拿去做GSEA再画图
# waterfall plot
query <- GDCquery(project = 'TCGA-LUAD',
data.category = "Simple Nucleotide Variation",
data.type = "Masked Somatic Mutation",
access = 'open')
GDCdownload(query)
GDCprepare(query,save = T,save.filename = 'TCGA-LUAD-SNP.Rdata')
load('TCGA-LUAD-SNP.Rdata')
luad_snp <- read.maf(maf=data)
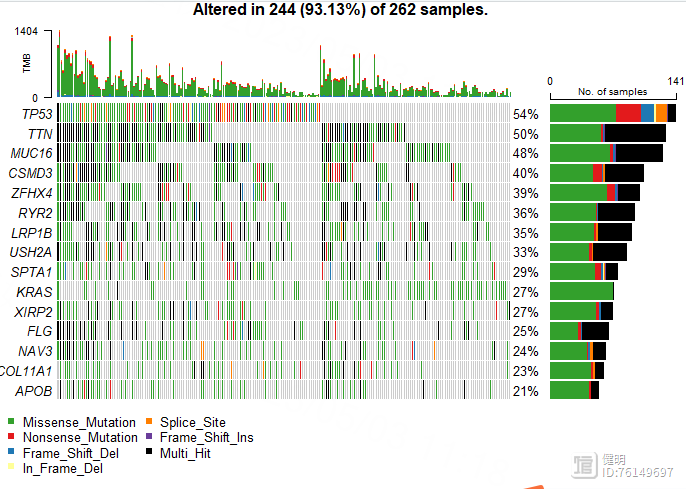
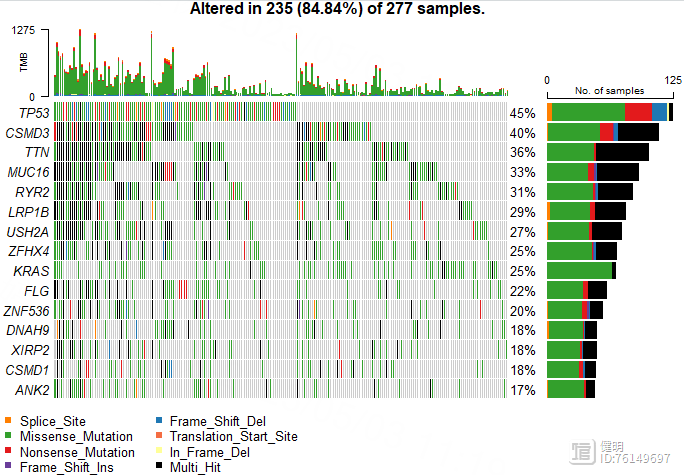
plotmafSummary(luad_snp,rmOutlier = TRUE, addStat = 'median', dashboard = TRUE, titvRaw = FALSE)
oncoplot(luad_snp,top = 15)
Step 7. 高低风险组间的免疫浸润
library(GSVA)library(GSEABase)
library(ggplot2)
library(tidyr)
rm(list = ls())
#1. 获取geneSets
# 下载28种免疫细胞的参考基因集 </TISIDB/data/download/CellReports.txt>
geneSet <- read.csv("cellReport.txt",header = F,sep = "\t",)
geneSet[1:5,1:5]
geneSet <- t(tibble::column_to_rownames(geneSet,var = 'V1'))
gene_list <- list()
for (i in colnames(geneSet)){
gene_list[[i]] <- geneSet[,i]
gene_list[[i]] <-gene_list[[i]][gene_list[[i]]!='']
}
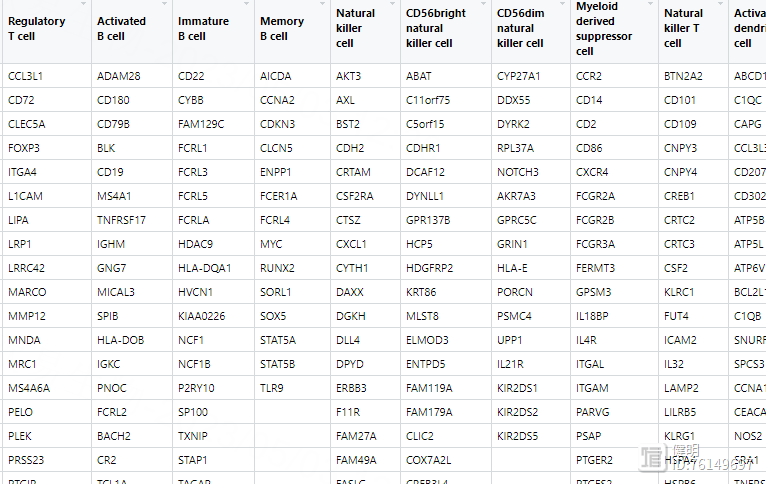
直接读取的geneSet长这样,有空值,需要转变成gene_list,list长度为28,其中每个元素是某个细胞所有基因的向量,名字是对应的细胞
# 载入表达矩阵,把表达矩阵分成high risk 和low risk组
load('TCGA_LUAD_TPM_exp.Rdata')
load('risk.Rdata')
# 对表达矩阵取log2
exp <- log2(exp 0.00001)
exp <- as.data.frame(exp)
colnames(exp) <- substr(colnames(exp),1,12)
exp <- exp[,!duplicated(colnames(exp))]
high_risk_sample <- km_data[km_data$risk=='high','ID']
low_risk_sample <- km_data[km_data$risk=='low','ID']
high_risk_exp <- exp[,high_risk_sample]
low_risk_exp <- exp[,low_risk_sample]
# ssGSEA
high_risk_gsea <- gsva(high_risk_exp,gene_list,method='ssgsea',kcdf='Gaussian',abs.ranking=T)
low_risk_gsea <- gsva(low_risk_exp,gene_list,method='ssgsea',kcdf='Gaussian',abs.ranking=T)
要注意gsva函数的输入得是matrix,不能是data.frame,不然会报错
hr_gsea_norm <- high_risk_gsea
for (i in colnames(hr_gsea_norm)) {
diff <- max(hr_gsea_norm[,i] )-min(hr_gsea_norm[,i] )
hr_gsea_norm[,i] <- (hr_gsea_norm[,i] -min(hr_gsea_norm[,i]))/diff
}
hr_gsea_norm <- as.data.frame(t(hr_gsea_norm))
hr_gsea_norm$type <- rep('high',times=nrow(hr_gsea_norm))
lr_gsea_norm <- low_risk_gsea
for (i in colnames(lr_gsea_norm)) {
diff <- max(lr_gsea_norm[,i] )-min(lr_gsea_norm[,i])
lr_gsea_norm[,i] <- (lr_gsea_norm[,i] -min(lr_gsea_norm[,i]))/diff
}
lr_gsea_norm <- as.data.frame(t(lr_gsea_norm))
lr_gsea_norm$type <- rep('low',times=nrow(lr_gsea_norm))
gsea_norm <- rbind(hr_gsea_norm,lr_gsea_norm)
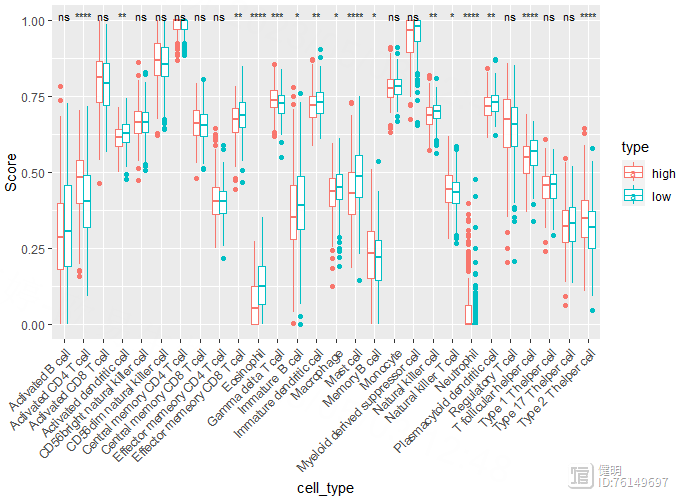
longer <- pivot_longer(gsea_norm,cols = !type,names_to = 'cell_type',values_to = 'Score')
ggplot(longer,aes(x=cell_type,y=Score,color=type)) geom_boxplot()
theme(axis.text.x = element_text(angle = 45,hjust = 1))
stat_compare_means(label = "p.signif",size=3,method = 'wilcox.test')
先把high risk gsea和low risk gsea的数据分别进行min max scale,新增一列标记上high和low,然后合并起来,行是样本,列是细胞。再把透视表转成长表,就可以画图了
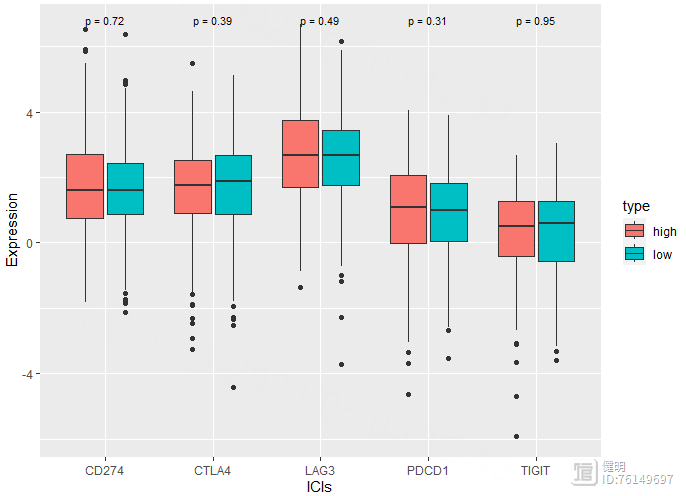
# 免疫检查点&TBM
risk_exp <- as.data.frame(t(exp))
risk_exp <- risk_exp[km_data$ID,]
risk_exp$type <- km_data$risk
risk_exp <- risk_exp[,c('CD274','PDCD1','CTLA4','LAG3','TIGIT','type')]
risk_long <- pivot_longer(risk_exp,cols = !type,names_to = 'ICIs',values_to = 'Expression')
ggplot(risk_long,aes(x=ICIs,y=Expression,fill=type)) geom_boxplot()
stat_compare_means(label = "p.format",size=3,method = 'wilcox.test')
文末友情宣传
强烈建议你推荐给身边的博士后以及年轻生物学PI,多一点数据认知,让他们的科研上一个台阶:
生物信息学马拉松授课(买一得五) ,你的生物信息学入门课144线程640Gb内存服务器共享一年仍然是仅需800千呼万唤始出来的独享生物信息学云服务器
- 0000
- 0000
- 0000
- 0000
- 0002


